Network Monitor
See every API call your app makes. Request, response, headers, timing, errors — all in real-time with zero configuration.
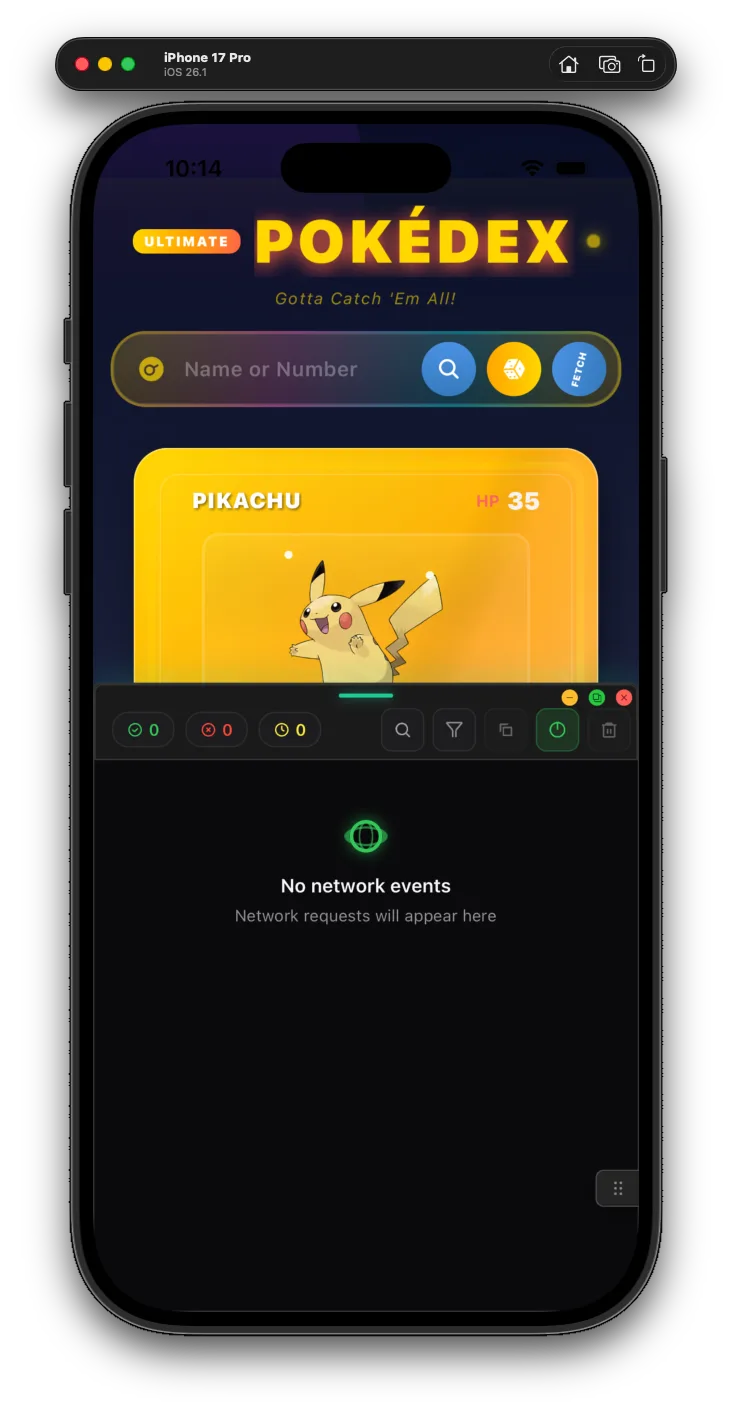
Network Monitor
Track all network requests in real-time. Filter by status with quick-access tabs showing counts.
Supported Clients
Everything riding dart:io's HttpClient is captured automatically:
| Captured | Notes |
|---|---|
| package:http | default IOClient |
| dio | attributed as dio in the panel |
| Image.network / NetworkImage | Flutter's own image loading |
| cached_network_image | cache misses / revalidations |
| graphql_flutter / ferry | tag with X-Request-Client: graphql for operation names |
GraphQL gets special treatment — Operation names are extracted from queries, mutations, and subscriptions, then displayed with variables using arrow notation: GetUser › 123. No more guessing which /graphql request is which.
Installation
flutter pub add buoy_network
flutter pub add buoy_network
Using the buoy umbrella? It's already included — the Network Monitor self-registers when you wrap your app in BuoyDevTools. Standalone, add one call before runApp:
import 'package:buoy_network/buoy_network.dart';

void main() {
  if (kDebugMode) registerBuoyNetwork(); // installs the HTTP hook + registers the tool
  runApp(const MyApp());
}
import 'package:buoy_network/buoy_network.dart';

void main() {
  if (kDebugMode) registerBuoyNetwork(); // installs the HTTP hook + registers the tool
  runApp(const MyApp());
}
What You See
For every request:
Full URL with query params extracted separately
GET, POST, PUT, DELETE, PATCH, etc.
Color-coded response status
Request time in milliseconds
Request and response headers
Payload and response (auto-parsed JSON)
Which HTTP client made the request
Status Colors
Known Gaps
Documented and on the roadmap: cupertino_http / cronet_http native clients, gRPC (raw sockets), secondary isolates, and Flutter web.
What's Next
- Storage Explorer — Browse and edit shared_preferences
- Environment Inspector — Validate env vars with type checking
- Riverpod Inspector — Watch every provider's live value