Documentation
All but React Native are in beta.
 Ask Buoy
- Camera
- Native Profiler
- Environment Inspector
- Events Timeline
 Console
- Sentry
- Network Monitor
- Storage Explorer
 Time Machine
 Scenarios
- Bug Links
- Memory Leaks
- Clock
- Lifecycle
- OTA Update Inspector
- Location
- Permissions
- Route Inspector
- Highlight Updates
- Bench
- JS Top
 React Query DevTools
 Redux DevTools
 Zustand DevTools
 Jotai DevTools
- Images
- Assets
 Impersonate Tool
- Image Overlay

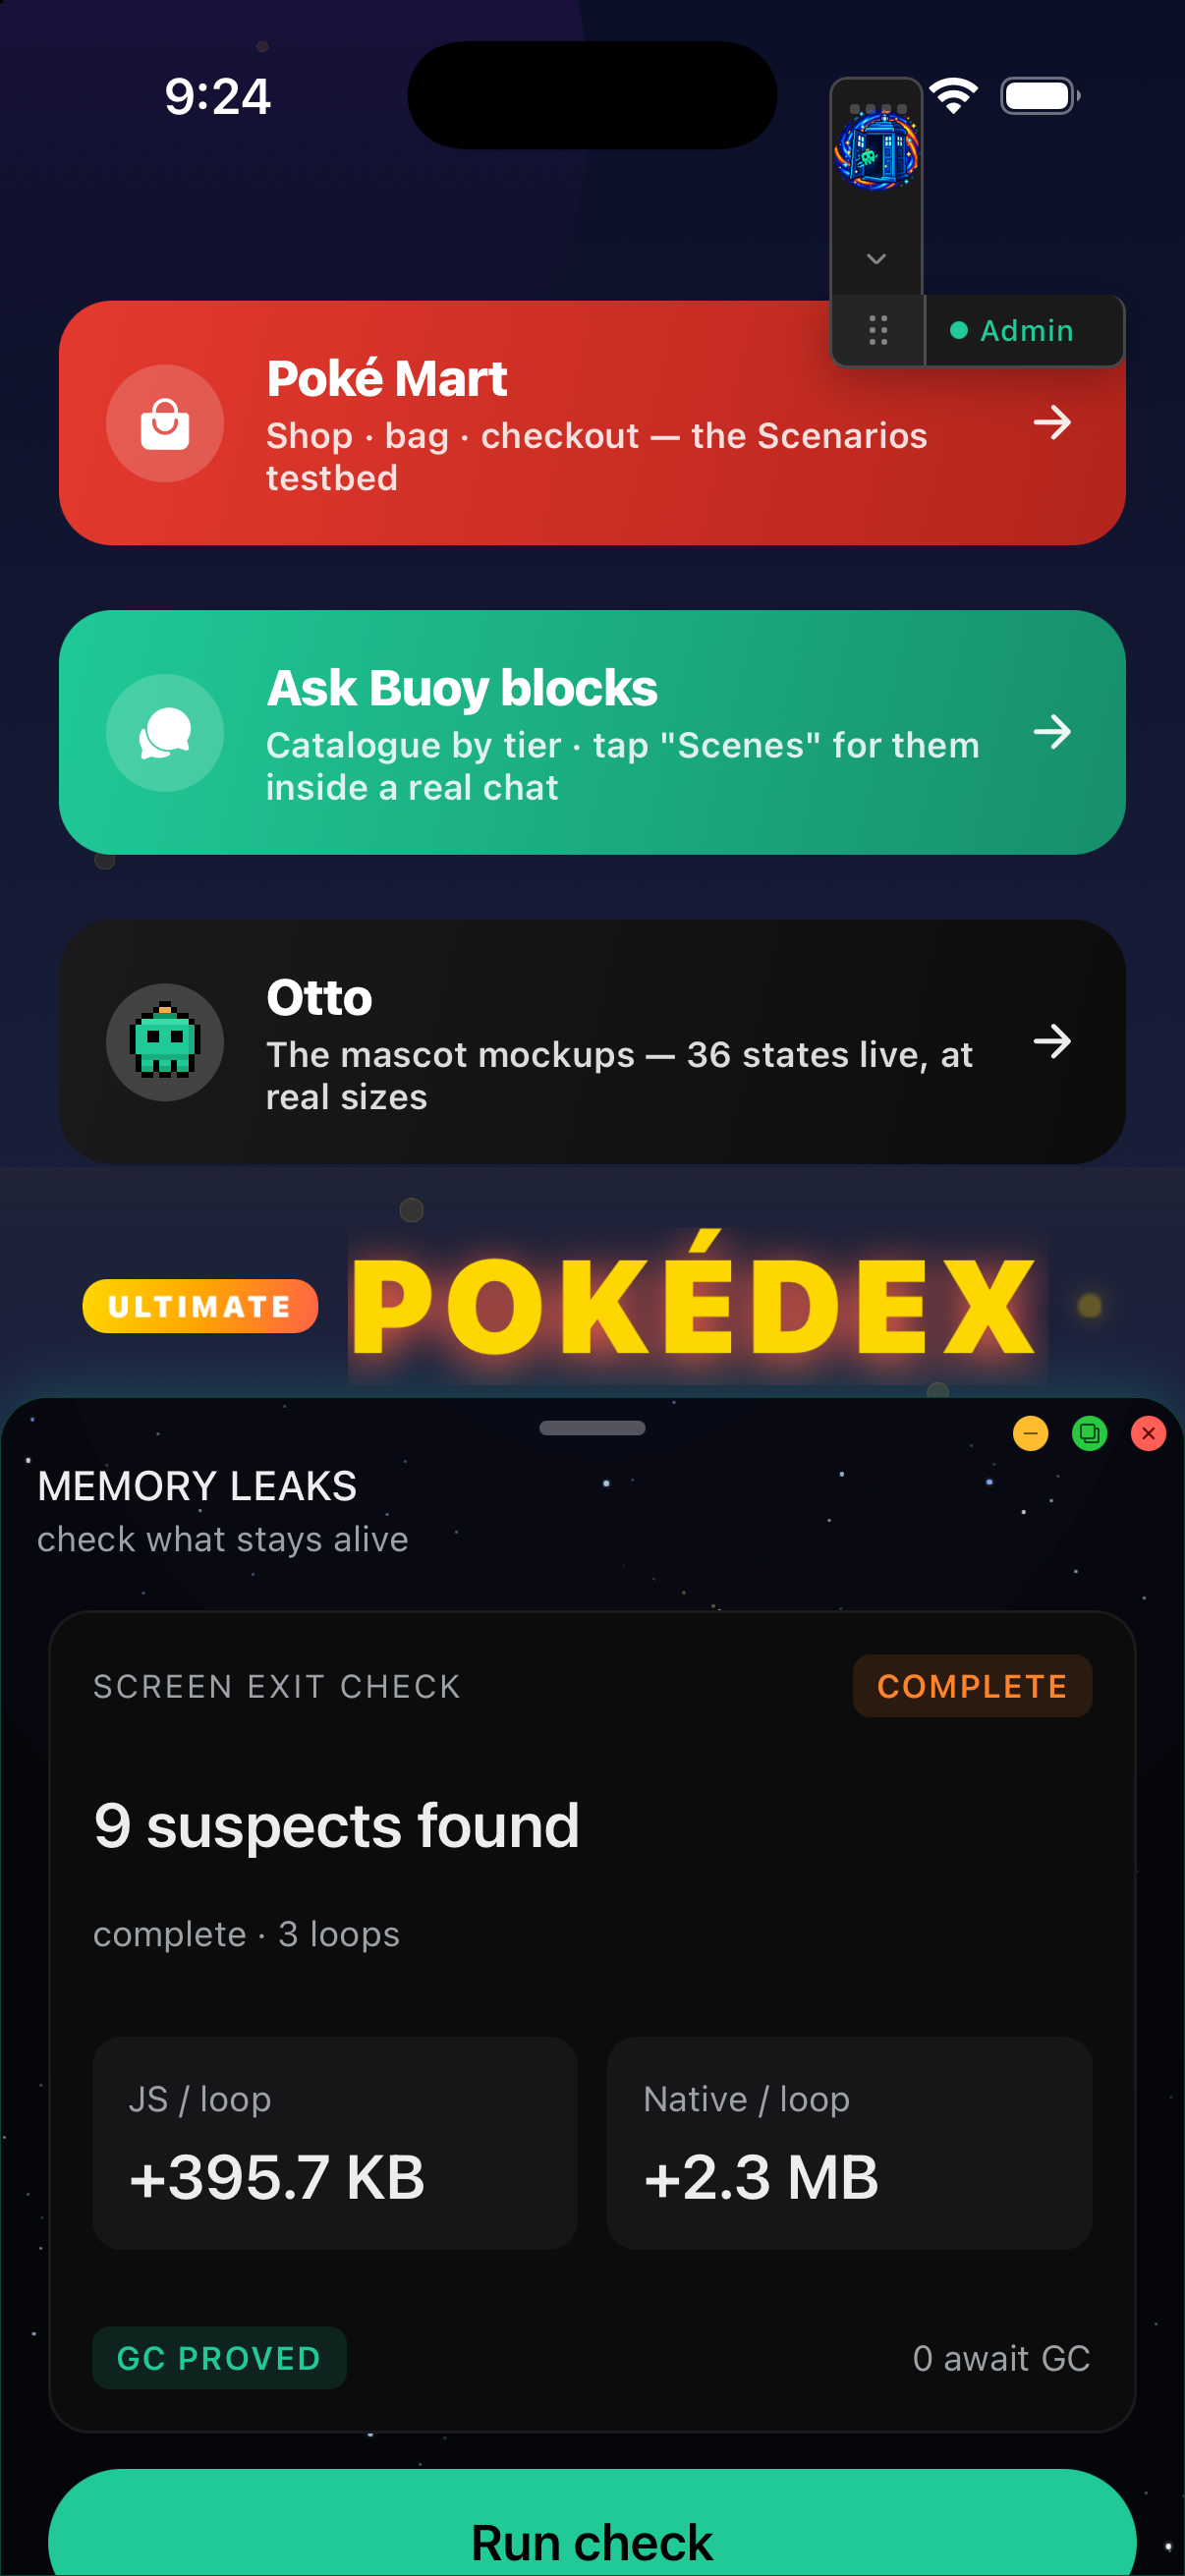
Memory Leaks checks what stays alive when a screen leaves. Each result is a suspect. It is a clue to check, not proof of a leak. This tool cannot find every leak.
Install
pnpm add @buoy-gg/memory-leaks
# Optional: timer counts and route loops
pnpm add @buoy-gg/clock @buoy-gg/route-events
pnpm add @buoy-gg/memory-leaks
# Optional: timer counts and route loops
pnpm add @buoy-gg/clock @buoy-gg/route-events
The tool shows up in the Buoy dial. Reads and checks need Pro. Capture works in native dev builds. Release imports do not start capture or patch app APIs. Web and Desktop show data from a linked device.
Clock is optional. Its shared feed tracks timers. Without Clock, the view says why timers are not tracked. Memory Leaks adds no second timer hook. Its headless tracking stops with the last watch. Clock keeps its own tracking when in use.
Route loops need the Routes tool and a mounted RouteTracker. Pick a home route and a test route. Use paths with no query or hash. Tap Run check. This moves the app through those routes. Keep work you need saved first.
The check warms both routes once. It then goes to the test route and back, up to 20 times. Five loops is the default. Each step waits 1.5 seconds by default. Short waits can catch work that ends late. Try a longer wait if an SDK still has live listeners. A run stops after three minutes. It also stops if the app leaves the foreground, Pro ends, or a route fails.
Read the result
component: a class instance, function props, or state object stayed alive after unmount. The name comes from React. Function rows show the owner path and route. Each unmount counts once, even if more than one object lives.intervalandtimeout: a timer from Clock's feed stayed live. A timeout may be valid work that is due later.listenerandsubscription: a tracked add call has no matching remove call yet. The source and add stack help you find it.
In route checks, function rows, timers and listeners need three loops and three seconds. Timeouts that are not due stay below the threshold. The view shows that count too. Manual watch has one exit, so it shows live adds at that exit.
Counts skip records from the warm pass. A warm record that ends does not hide new work. Work that was there before the run is not new growth. A source shared by two parts of the app can still be hard to place. Timer and listener cards show the app call site. Metro maps the stack to a file and line. Buoy, Clock and React frames are skipped. If a map is missing, open the raw add stack. A call site does not prove which screen owns that work. Reload after code edits before you run a check. An old bundle can use a stale source map.
AppState, Dimensions, Keyboard, Linking, DeviceEventEmitter and NativeEventEmitter are covered. NetInfo is covered when installed. React Query and zustand hooks are planned follow-ups.
The VM must support WeakRef for object checks. Finalizers are optional. Two live reads after distinct proved GC passes give survived-gc. If GC cannot be proved, a live object needs at least three loops and three seconds to become a suspect. Those rows say repeated-growth. Other live rows say still-live.
Function checks read props and object hook values. This includes state, refs and memo values. They skip React queues and effect lists. Shared objects count once. Cached props can still give false hits. Use useMemoryLeakWatch for a stable target you own. No fiber tree is read while a check is off.
An empty list does not prove clean. Check the GC note and each missing-source note. The tool stores weak refs. It does not keep watched objects alive.
Watch your own object
import { useRef } from "react";
import { useMemoryLeakWatch } from "@buoy-gg/memory-leaks";

function Details() {
  const model = useRef({ label: "details" });
  useMemoryLeakWatch("Details model", model.current);
  return null;
}
import { useRef } from "react";
import { useMemoryLeakWatch } from "@buoy-gg/memory-leaks";

function Details() {
  const model = useRef({ label: "details" });
  useMemoryLeakWatch("Details model", model.current);
  return null;
}
Start Watch exit before you enter that screen. Leave it, then tap Finish watch. Keep the target object stable across renders. A hidden tab may stay mounted. The check needs an unmount; a route change alone is not enough. A function's escaped closure can outlive its watched object.
Growth and limits
JS growth uses Hermes live bytes. Native growth uses Perf Monitor's native reader when it can read bytes. Missing reads stay null, with a reason. Each growth value is (lastBytes - baseBytes) / completedLoops. Cards show KB or MB. Falls show as a negative value. Growth and suspects may have different causes.
Stop ends capture. Clear drops the last report. Neither action clears app timers or frees app leaks. A reload drops the run. The view holds one report, up to 200 groups. Capture holds at most 5,000 records. Stacks have at most eight frames. Names and source paths have size caps too. Each read strips web URLs from add stacks. Dropped counts show in the report. Props, state and callback bodies are not sent to Desktop.
Full heap snapshots are not part of this tool yet. Use the Memory view in React Native DevTools for heap root paths.
MCP and Desktop
Desktop shows the same report and sends actions to the chosen device. It does not check its own heap.
{"tool":"memory_check","arguments":{"action":"start","baselinePath":"/home","targetPath":"/details","cycles":5}}
{"tool":"get_memory_leaks","arguments":{"runId":"<id from start>","limit":20}}
{"tool":"memory_check","arguments":{"action":"stop","runId":"<id from start>"}}
{"tool":"memory_check","arguments":{"action":"start","baselinePath":"/home","targetPath":"/details","cycles":5}}
{"tool":"get_memory_leaks","arguments":{"runId":"<id from start>","limit":20}}
{"tool":"memory_check","arguments":{"action":"stop","runId":"<id from start>"}}
ownerPath shows the function owner chain. appSource holds the app call site or null. Both fields pass through MCP and Desktop.
Start returns a run ID at once. Poll for results. Reads can filter by kind. The max limit is 100. Do not retry a start just because a link dropped. Read the current report first.
The sync adapter is memoryLeaksSyncAdapter, version 1. Its actions are startCheck, startWatch, finishWatch, getReport, stopCheck, and clearReports. Ask Buoy uses these same actions.